| Filename | Latest commit message | Latest commit date |
|---|---|---|
 c3e9d4d694 * fix(threejs-server): use server.registerTool for non-UI tool The learn_threejs tool doesn't have a UI component - it only returns documentation text. Using registerAppTool without _meta causes a runtime error when the function tries to access config._meta.ui. Fixes crash: "Cannot read property 'ui' of undefined" 🤖 Generated with [Claude Code](https://claude.com/claude-code) Co-Authored-By: Claude <noreply@anthropic.com> * fix(examples): add missing registerAppTool and registerAppResource imports All example servers were using registerAppTool and registerAppResource but not importing them from @modelcontextprotocol/ext-apps/server, causing "ReferenceError: registerAppTool is not defined" at runtime. Affected servers: - budget-allocator-server - cohort-heatmap-server - customer-segmentation-server - scenario-modeler-server - system-monitor-server - threejs-server - wiki-explorer-server 🤖 Generated with [Claude Code](https://claude.com/claude-code) Co-Authored-By: Claude <noreply@anthropic.com> --------- Co-authored-by: Claude <noreply@anthropic.com> |
||
| .. | ||
| src | ||
| mcp-app.html | ||
| package.json | ||
| README.md | ||
| server.ts | ||
| tsconfig.json | ||
| vite.config.ts | ||
Example: Budget Allocator App
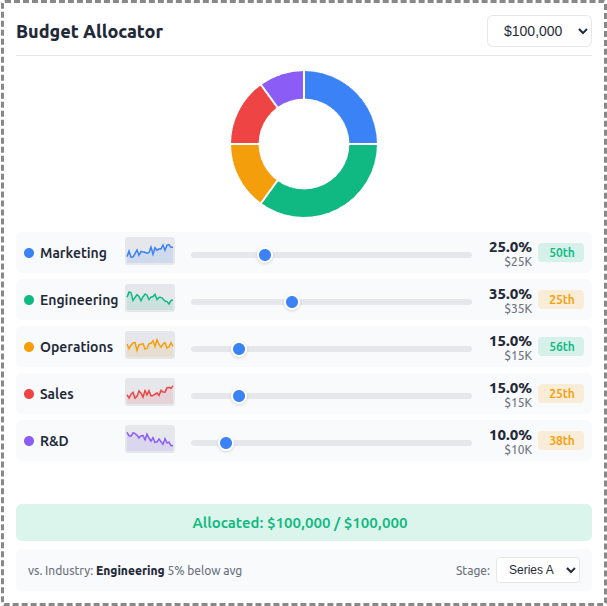
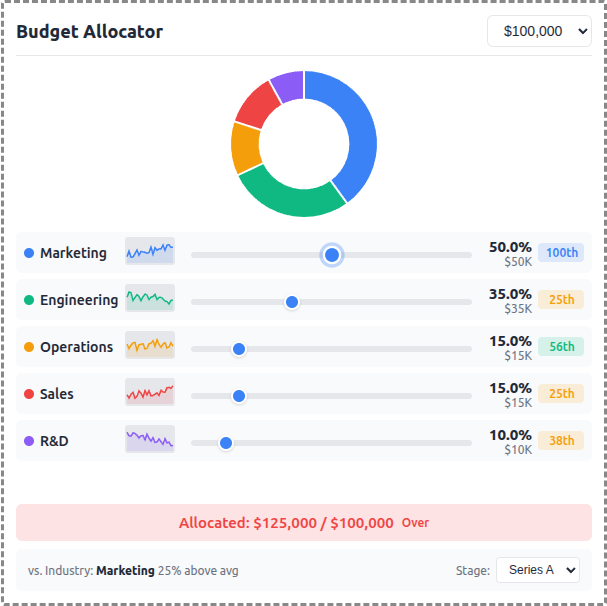
An interactive budget allocation tool demonstrating real-time data visualization with MCP Apps.
 |
 |
 |
Features
- Interactive Sliders: Adjust budget allocation across 5 categories (Marketing, Engineering, Operations, Sales, R&D)
- Donut Chart: Real-time visualization of allocation distribution using Chart.js
- Sparkline Trends: 24-month historical allocation data per category
- Percentile Badges: Compare your allocation vs. industry benchmarks
- Stage Selector: Switch between Seed, Series A, Series B, and Growth benchmarks
- Budget Presets: Quick selection of $50K, $100K, $250K, or $500K totals
Running
-
Install dependencies:
npm install -
Build and start the server:
npm run start:http # for Streamable HTTP transport # OR npm run start:stdio # for stdio transport -
View using the
basic-hostexample or another MCP Apps-compatible host.
Architecture
Server (server.ts)
Exposes a single get-budget-data tool that returns:
- Category definitions with colors and default allocations
- Historical data (~120 data points) - 24 months of allocation history per category
- Industry benchmarks (~60 data points) - Aggregated percentile data by company stage
The tool is linked to a UI resource via _meta.ui.resourceUri.
App (src/mcp-app.ts)
- Uses Chart.js for the donut chart visualization
- Renders sparkline trends using inline SVG
- Computes percentile rankings client-side from benchmark data
- Updates all UI elements reactively on slider changes