| Filename | Latest commit message | Latest commit date |
|---|---|---|
 9e9f5f0210 * Centralize example server transport logic in shared utils Move stdio/HTTP transport handling into `server-utils.ts` so example servers only need to call `startServer(createServer)`. Switch HTTP transport to stateless mode and remove legacy SSE endpoints. 🤖 Generated with [Claude Code](https://claude.com/claude-code) Co-Authored-By: Claude Opus 4.5 <noreply@anthropic.com> * Make example servers self-contained with local server-utils Copy `server-utils.ts` into each example's `src/` directory so examples can be used standalone without the shared directory. Updates imports from `"../shared/server-utils.js"` to `"./src/server-utils.js"`. 🤖 Generated with [Claude Code](https://claude.com/claude-code) Co-Authored-By: Claude Opus 4.5 <noreply@anthropic.com> * Add `integration-server` example for E2E testing Add dedicated `integration-server` example (duplicated from `basic-server-react`) to preserve E2E testing capabilities while allowing `basic-server-react` to be simplified as a minimal example. Changes: - Add `examples/integration-server` exercising SDK communication APIs - Update E2E tests to use `integration-server` instead of `basic-server-react` and `basic-server-vanillajs` - Use server name labels instead of indices for more robust test selection - Remove `basic-react.png` and `basic-vanillajs.png` golden snapshots 🤖 Generated with [Claude Code](https://claude.com/claude-code) Co-Authored-By: Claude <noreply@anthropic.com> * Simplify `basic-server-*` examples - Clarify comments - Return plain text from `get-time` tool instead of JSON - Remove simulated cleanup delay from `onteardown` 🤖 Generated with [Claude Code](https://claude.com/claude-code) Co-Authored-By: Claude Opus 4.5 <noreply@anthropic.com> --------- Co-authored-by: Claude Opus 4.5 <noreply@anthropic.com> |
||
| .. | ||
| src | ||
| mcp-app.html | ||
| package.json | ||
| README.md | ||
| server.ts | ||
| tsconfig.json | ||
| vite.config.ts | ||
Example: Cohort Heatmap App
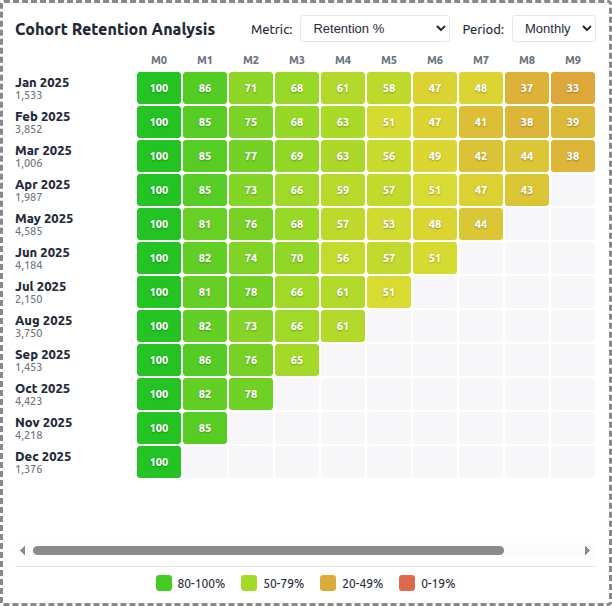
A demo MCP App that displays cohort retention data as an interactive heatmap, showing customer retention over time by signup month.
 |
 |
 |
Features
- Cohort Retention Heatmap: Color-coded grid showing retention percentages across cohorts and time periods
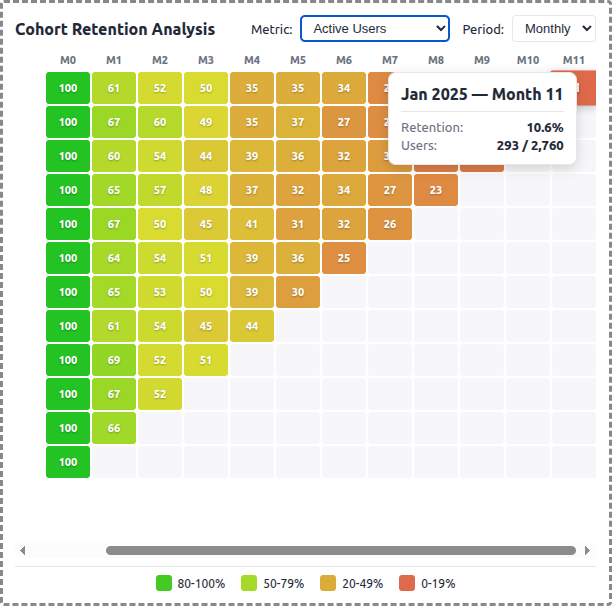
- Multiple Metrics: Switch between Retention %, Revenue Retention, and Active Users
- Period Types: View data by monthly or weekly intervals
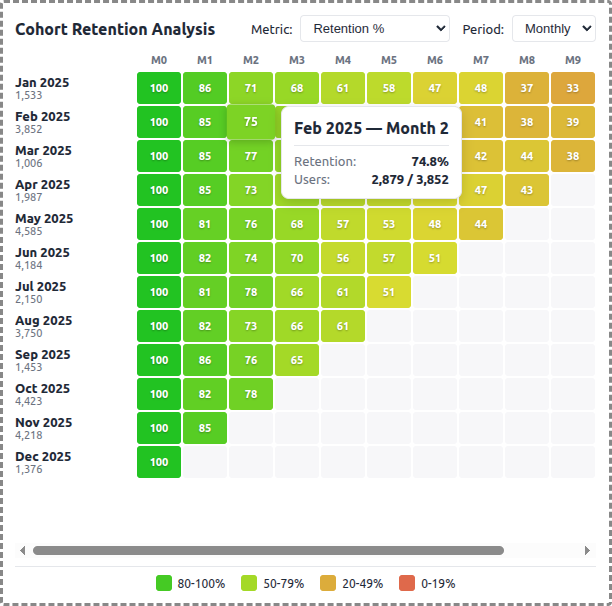
- Interactive Exploration: Hover cells for detailed tooltips, click to highlight rows/columns
- Color Scale: Green (high retention) through yellow to red (low retention)
- Theme Support: Adapts to light/dark mode preferences
Running
-
Install dependencies:
npm install -
Build and start the server:
npm run start:http # for Streamable HTTP transport # OR npm run start:stdio # for stdio transport -
View using the
basic-hostexample or another MCP Apps-compatible host.
Architecture
Server (server.ts)
Exposes a single get-cohort-data tool that returns:
- Cohort rows with signup month, original user count, and retention cells
- Period headers and labels
- Configurable parameters: metric type, period type, cohort count, max periods
The tool generates synthetic cohort data using an exponential decay model with configurable retention curves per metric type.
App (src/mcp-app.tsx)
- Uses React for the heatmap visualization
- Fetches data on mount and when filters change
- Displays retention percentages in a grid with HSL color interpolation
- Shows detailed tooltips on hover with user counts and exact retention values
- Supports row/column highlighting on cell click