| Filename | Latest commit message | Latest commit date |
|---|---|---|
 8550545ccb According to spec, mimeType should be present in both the resource declaration and the resource content. This adds the missing mimeType to the registerResource() declaration (third parameter) in all example servers and the quickstart documentation. 🤖 Generated with [Claude Code](https://claude.com/claude-code) Co-authored-by: Claude <noreply@anthropic.com> Co-authored-by: ochafik <olivier.chafik@gmail.com> |
||
| .. | ||
| src | ||
| mcp-app.html | ||
| package.json | ||
| README.md | ||
| server.ts | ||
| tsconfig.json | ||
| vite.config.ts | ||
Example: Cohort Heatmap App
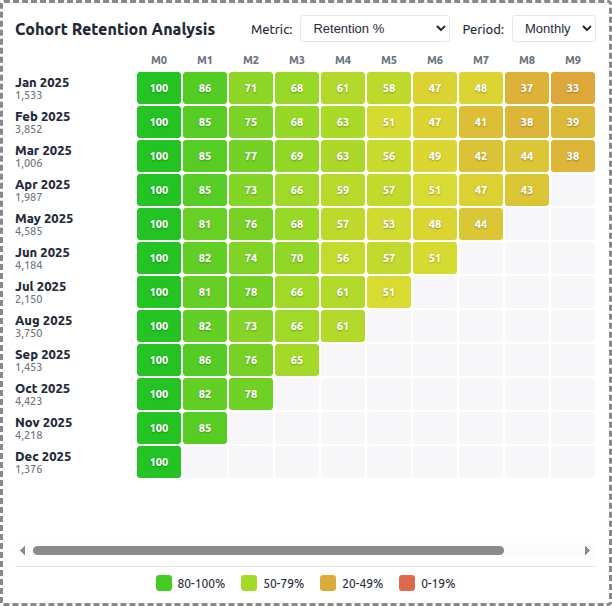
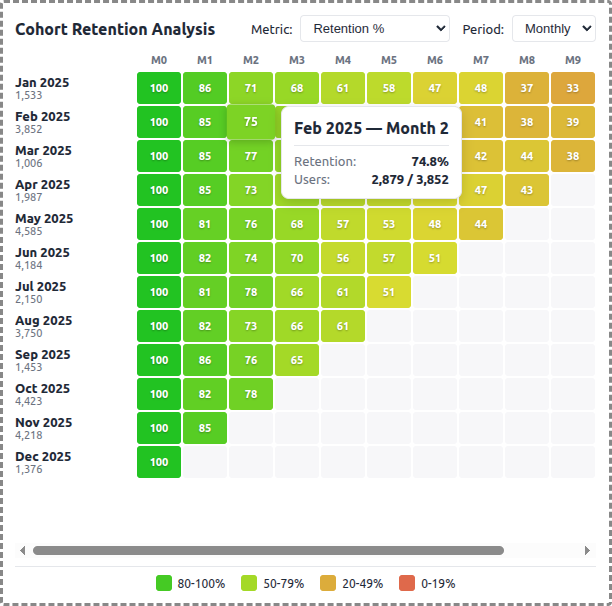
A demo MCP App that displays cohort retention data as an interactive heatmap, showing customer retention over time by signup month.
 |
 |
 |
Features
- Cohort Retention Heatmap: Color-coded grid showing retention percentages across cohorts and time periods
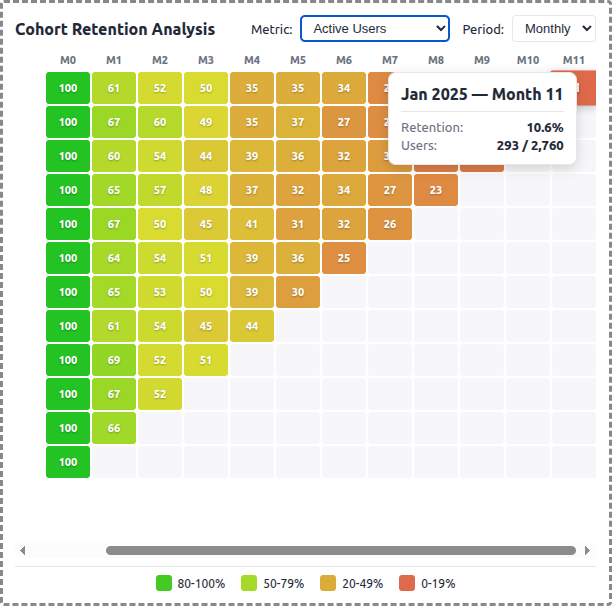
- Multiple Metrics: Switch between Retention %, Revenue Retention, and Active Users
- Period Types: View data by monthly or weekly intervals
- Interactive Exploration: Hover cells for detailed tooltips, click to highlight rows/columns
- Color Scale: Green (high retention) through yellow to red (low retention)
- Theme Support: Adapts to light/dark mode preferences
Running
-
Install dependencies:
npm install -
Build and start the server:
npm run start:http # for Streamable HTTP transport # OR npm run start:stdio # for stdio transport -
View using the
basic-hostexample or another MCP Apps-compatible host.
Architecture
Server (server.ts)
Exposes a single get-cohort-data tool that returns:
- Cohort rows with signup month, original user count, and retention cells
- Period headers and labels
- Configurable parameters: metric type, period type, cohort count, max periods
The tool generates synthetic cohort data using an exponential decay model with configurable retention curves per metric type.
App (src/mcp-app.tsx)
- Uses React for the heatmap visualization
- Fetches data on mount and when filters change
- Displays retention percentages in a grid with HSL color interpolation
- Shows detailed tooltips on hover with user counts and exact retention values
- Supports row/column highlighting on cell click