| Filename | Latest commit message | Latest commit date |
|---|---|---|
 c3e9d4d694 * fix(threejs-server): use server.registerTool for non-UI tool The learn_threejs tool doesn't have a UI component - it only returns documentation text. Using registerAppTool without _meta causes a runtime error when the function tries to access config._meta.ui. Fixes crash: "Cannot read property 'ui' of undefined" 🤖 Generated with [Claude Code](https://claude.com/claude-code) Co-Authored-By: Claude <noreply@anthropic.com> * fix(examples): add missing registerAppTool and registerAppResource imports All example servers were using registerAppTool and registerAppResource but not importing them from @modelcontextprotocol/ext-apps/server, causing "ReferenceError: registerAppTool is not defined" at runtime. Affected servers: - budget-allocator-server - cohort-heatmap-server - customer-segmentation-server - scenario-modeler-server - system-monitor-server - threejs-server - wiki-explorer-server 🤖 Generated with [Claude Code](https://claude.com/claude-code) Co-Authored-By: Claude <noreply@anthropic.com> --------- Co-authored-by: Claude <noreply@anthropic.com> |
||
| .. | ||
| src | ||
| mcp-app.html | ||
| package.json | ||
| README.md | ||
| server.ts | ||
| tsconfig.json | ||
| vite.config.ts | ||
Example: Cohort Heatmap App
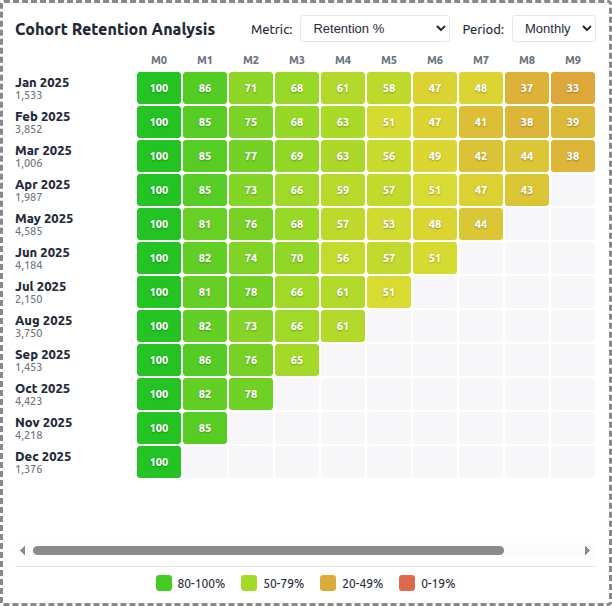
A demo MCP App that displays cohort retention data as an interactive heatmap, showing customer retention over time by signup month.
 |
 |
 |
Features
- Cohort Retention Heatmap: Color-coded grid showing retention percentages across cohorts and time periods
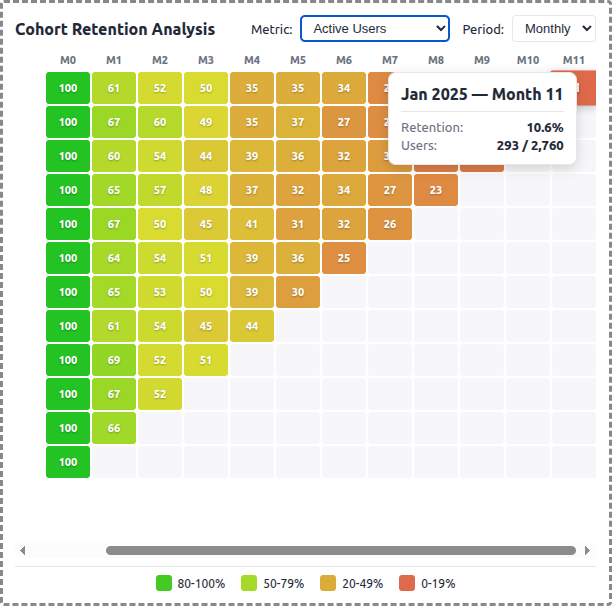
- Multiple Metrics: Switch between Retention %, Revenue Retention, and Active Users
- Period Types: View data by monthly or weekly intervals
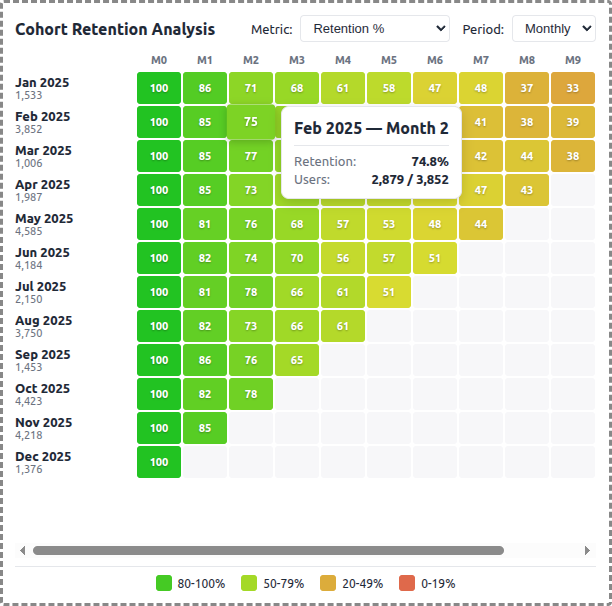
- Interactive Exploration: Hover cells for detailed tooltips, click to highlight rows/columns
- Color Scale: Green (high retention) through yellow to red (low retention)
- Theme Support: Adapts to light/dark mode preferences
Running
-
Install dependencies:
npm install -
Build and start the server:
npm run start:http # for Streamable HTTP transport # OR npm run start:stdio # for stdio transport -
View using the
basic-hostexample or another MCP Apps-compatible host.
Architecture
Server (server.ts)
Exposes a single get-cohort-data tool that returns:
- Cohort rows with signup month, original user count, and retention cells
- Period headers and labels
- Configurable parameters: metric type, period type, cohort count, max periods
The tool generates synthetic cohort data using an exponential decay model with configurable retention curves per metric type.
App (src/mcp-app.tsx)
- Uses React for the heatmap visualization
- Fetches data on mount and when filters change
- Displays retention percentages in a grid with HSL color interpolation
- Shows detailed tooltips on hover with user counts and exact retention values
- Supports row/column highlighting on cell click