 George Lambert
c5d286dc6b
George Lambert
c5d286dc6b
Second ladder executed entirely on NS1.GEORGELAMBERT.ORG (70.88.205.138)
against LXC 511–513; HTML and PDF built on that host.
17 KiB
Progress report (second study) · run 20260912T051237Z (UTC)
Execution provenance. Every process for this study ran on NS1.GEORGELAMBERT.ORG (
70.88.205.138): the orchestrator (study-on-ns1.sh),nats bench,latency.mjs(inside LXC 510 on this hypervisor), charting (matplotlib), and HTML/PDF (pandoc+weasyprint). The operator laptop did not publish, subscribe, draw charts, or render the PDF. Traffic stayed onvmbr1from LXC 510 tonats-a/b/c(511–513).
This is a full methodology write-up plus the numbers from that on-host run. The earlier report (nats-cluster-bench, run 20260912T045131Z) used the same cluster but was orchestrated and rendered off-box. Use this document when you need “it was all run on 138.”
1. Executive summary
| Item | This NS1-host run |
|---|---|
| Control plane | NS1.GEORGELAMBERT.ORG (70.88.205.138), user marchon |
| Bench client | LXC 510 verae-px-worker |
| Brokers | LXC 511/512/513 nats-a/b/c on 10.10.10.21–23 |
| Client URL | nats://10.10.10.21:4222,nats://10.10.10.22:4222,nats://10.10.10.23:4222 |
| Host load before | 8.59 8.39 8.15 5/3843 4096277 |
| Host load after | 8.67 8.33 8.15 9/3863 4114865 |
| Core 1p1s 128 B pub | 502,502 msgs/s |
| JetStream 1p 128 B r=3 | 7,393 durable pubs/s |
| Ping p50 / p99 | 0.395ms / 1.377ms |
Product traffic is the JetStream row. Ping is one-message delay. Flood is mailbox catch-up after a burst.
2. Where it ran (and where it did not)
Operator laptop  ──ssh──►  NS1.GEORGELAMBERT.ORG  70.88.205.138
                              study-on-ns1.sh
                              python3 build-ns1-study-report.py
                              sudo pct exec 510 ──► nats bench / latency.mjs
                                                    │
                                                    ▼ vmbr1
                                              10.10.10.21-23 :4222
- Did run on 138: bash, python3, matplotlib, pandoc, weasyprint,
pct, nats-server (in LXC), nats CLI and Node (in LXC 510). - Did not run on the laptop: no local
nats bench, no local charting, no local WeasyPrint for this file.
3. Results (this run)
Host and brokers
Before
| Node | VMID | connections | in_msgs | out_msgs | cpu | cores | mem (B) | jetstream |
|---|---|---|---|---|---|---|---|---|
| nats-a | 511 | 2 | 1,721,203 | 4,933,759 | 1 | 1 | 26,398,720 | True |
| nats-b | 512 | 2 | 1,613,205 | 3,513,096 | 0 | 1 | 23,097,344 | True |
| nats-c | 513 | 2 | 1,760,973 | 4,048,582 | 2 | 1 | 23,867,392 | True |
After
| Node | VMID | connections | in_msgs | out_msgs | cpu | cores | mem (B) | jetstream |
|---|---|---|---|---|---|---|---|---|
| nats-a | 511 | 2 | 2,097,596 | 5,910,161 | 1 | 1 | 38,273,024 | True |
| nats-b | 512 | 2 | 2,121,816 | 4,746,539 | 1 | 1 | 41,361,408 | True |
| nats-c | 513 | 2 | 2,241,366 | 5,053,978 | 1 | 1 | 38,162,432 | True |
nproc=40 · uname=Linux NS1.GEORGELAMBERT.ORG 6.17.2-1-pve #1 SMP PREEMPT_DYNAMIC PMX 6.17.2-1 (2025-10-21T11:55Z) x86_64 GNU/Linux
Throughput
| Run | Mode | Aggregate msgs/s | Pub msgs/s | Pub MB/s | Sub msgs/s | Sub MB/s |
|---|---|---|---|---|---|---|
core-1p1s-50k-128 |
core pub/sub | 776,331 | 502,502 | 61.34 | 420,976 | 51.39 |
core-4p4s-100k-128 |
core pub/sub | 1,278,454 | 379,985 | 46.38 | 1,078,910 | 131.70 |
core-4p4s-50k-1k |
core pub/sub | 581,464 | 209,545 | 204.63 | 482,645 | 471.33 |
core-8p8s-200k-128 |
core pub/sub | 2,065,217 | 333,731 | 40.74 | 1,847,242 | 225.49 |
js-1p-20k-128-r3 |
jetstream r=3 file | — | 7,393 | 0.90 | — | — |
js-2p2s-20k-128-r3 |
jetstream r=3 file | 15,416 | 7,728 | 0.94 | 7,711 | 0.94 |
js-4p-20k-1k-r3 |
jetstream r=3 file | — | 14,985 | 14.63 | — | — |
js-4p-50k-128-r3 |
jetstream r=3 file | — | 17,986 | 2.20 | — | — |
Round-trip delay
| Run | Kind | Count | Pubs | Size | min | avg | p50 | p90 | p99 | max |
|---|---|---|---|---|---|---|---|---|---|---|
lat-ping-1k-128 |
ping (sequential RTT) | 1000 | 1 | 128 B | 0.341ms | 0.470ms | 0.395ms | 0.651ms | 1.377ms | 3.243ms |
lat-1p-5k-128 |
flood (burst queueing) | 5000 | 1 | 128 B | 132.425ms | 203.717ms | 204.458ms | 241.750ms | 249.468ms | 249.640ms |
lat-4p-5k-1k |
flood (burst queueing) | 5000 | 4 | 1024 B | 196.422ms | 221.264ms | 224.039ms | 233.180ms | 236.798ms | 238.177ms |
lat-4p-10k-128 |
flood (burst queueing) | 10000 | 4 | 128 B | 211.108ms | 294.925ms | 300.254ms | 314.223ms | 315.551ms | 316.091ms |
lat-8p-20k-128 |
flood (burst queueing) | 20000 | 8 | 128 B | 280.608ms | 414.972ms | 409.802ms | 513.821ms | 535.394ms | 536.084ms |
Core NATS
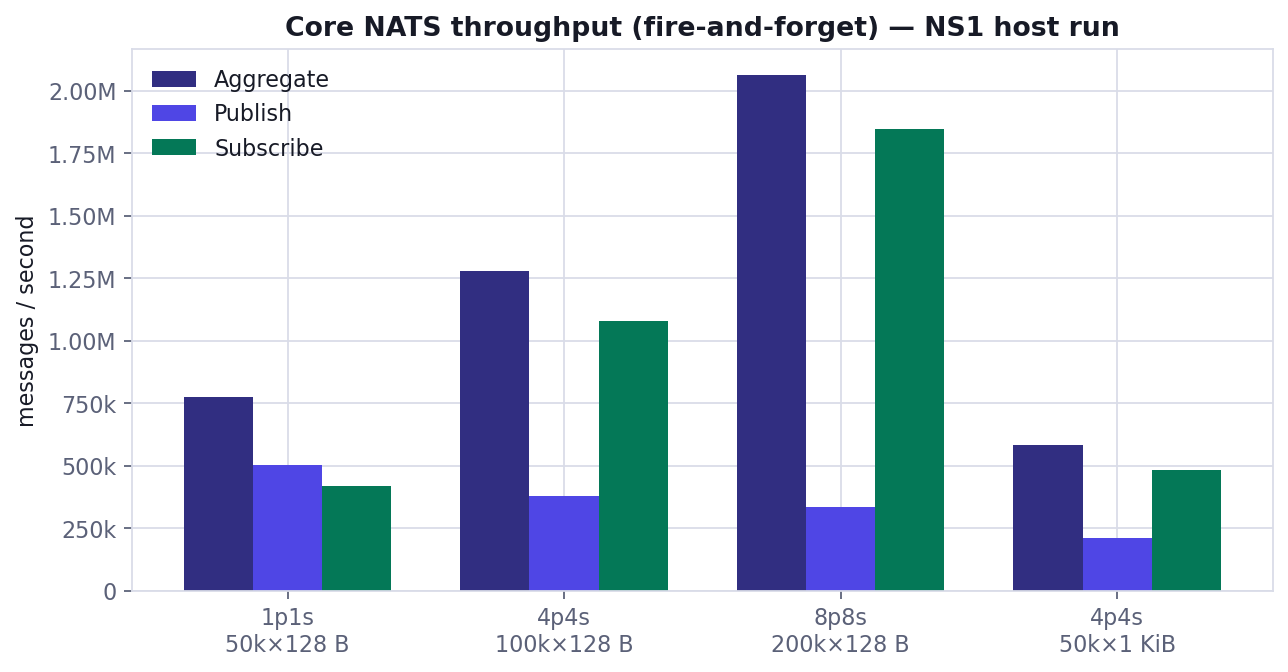
Core NATS throughput at four loads (NS1 host run)
Payload size (core)
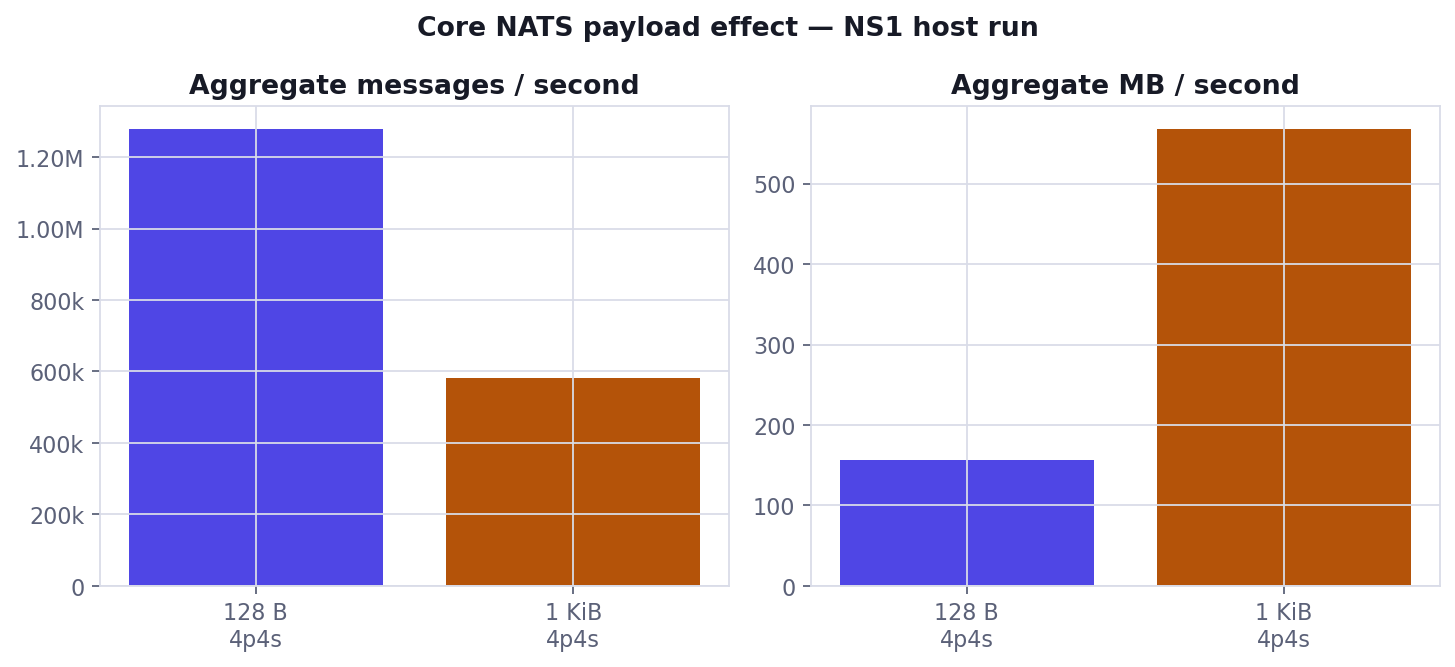
Core NATS 128 B vs 1 KiB (NS1 host run)
JetStream r=3 file
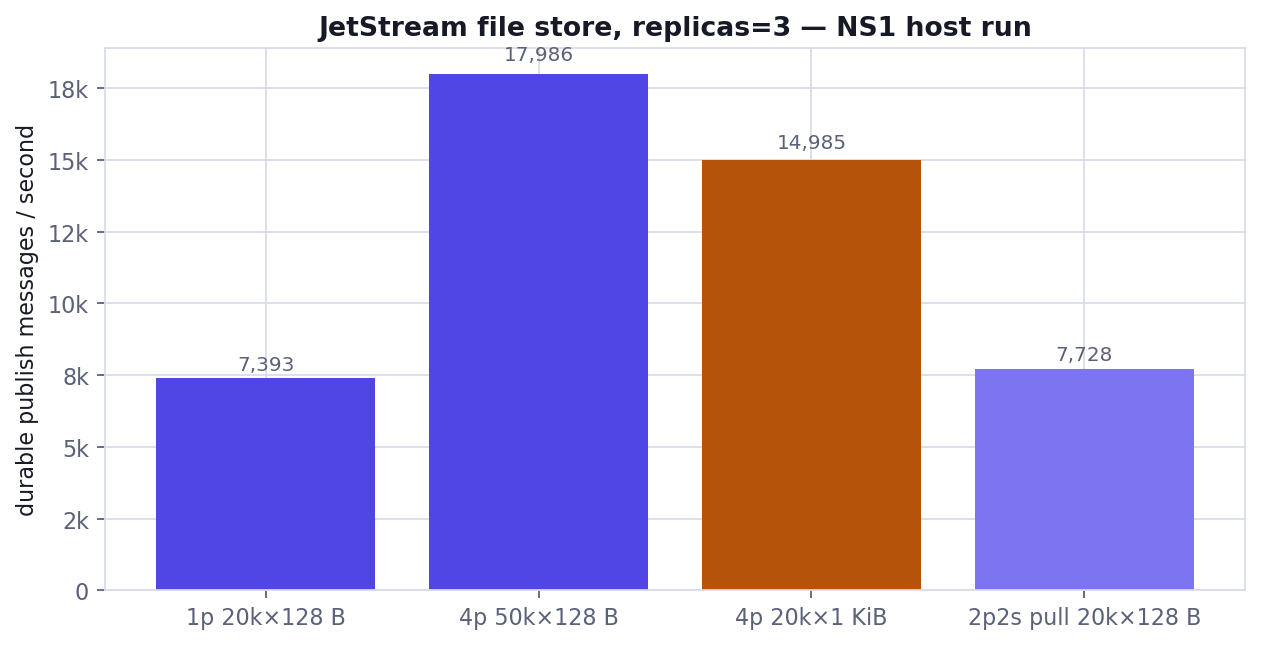
JetStream durable publish rate (NS1 host run)
Core vs JetStream
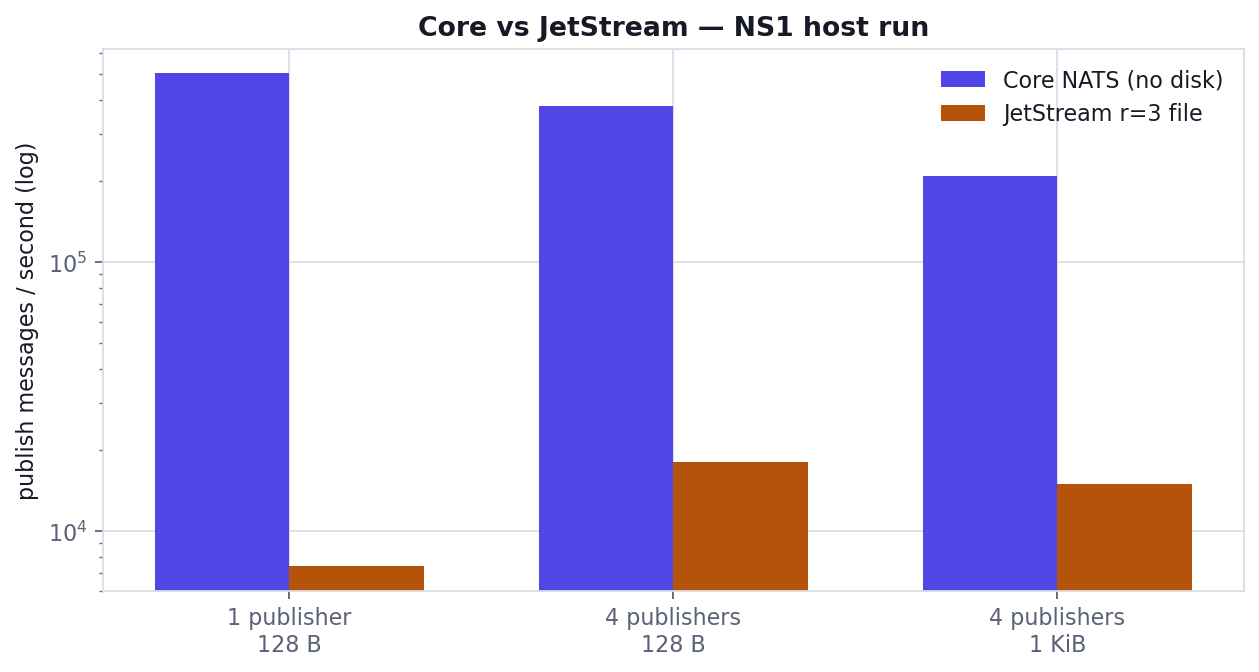
Core vs JetStream publish rate, log scale (NS1 host run)
Delay
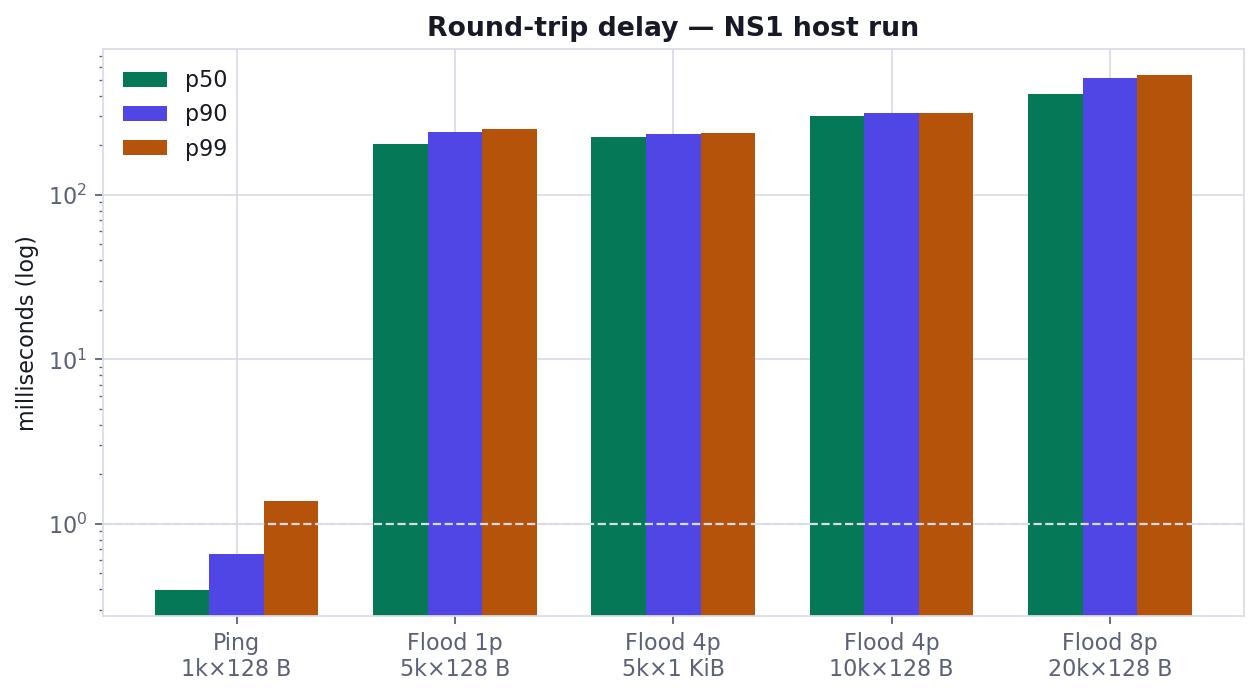
Ping vs flood delay percentiles, log scale (NS1 host run)
4. Study methodology
4.1 Question
On the NS1 test stand, what message throughput and delay does the three-node verae JetStream cluster deliver at several loads, and which part of the stack is the limiter for product traffic (jobs, events, webhooks, archive)?
4.2 Hypotheses (stated before the run)
- H1 — Core vs JetStream. Fire-and-forget core NATS is at least an order of magnitude faster than JetStream file + replicas=3, because durable publish waits for a majority disk replica.
- H2 — JetStream parallelism. Adding publishers does not linearly increase JetStream write rate once the replica log is saturated.
- H3 — Quiet delay. Sequential pub→sub round trip on
vmbr1is well under 1 ms p99 when the consumer is waiting. - H4 — Burst delay. If publishers dump a batch before the subscriber drains, observed delay is queueing time, roughly linear in backlog, not in cluster hop count.
- H5 — Payload. Moving 128 B → 1 KiB lowers message rate and raises byte rate on core NATS; JetStream in this size band stays replica/fsync bound.
4.3 Independent variables (what we changed)
| Factor | Levels |
|---|---|
| Transport | Core NATS pub/sub vs JetStream file replicas=3 |
| Publisher count | 1, 2, 4, 8 |
| Subscriber count | 0 (JS publish-only), 1, 2, 4, 8 |
| Message count | 1k, 5k, 10k, 20k, 50k, 100k, 200k (by ladder step) |
| Payload | 128 B, 1024 B |
| Delay mode | ping (publish, wait, repeat) vs flood (publish all, then drain) |
4.4 Dependent variables (what we recorded)
| Metric | Instrument | Unit |
|---|---|---|
| Publish rate | nats bench 0.1.6 Pub stats |
msgs/s, MB/s |
| Subscribe rate | nats bench Sub stats |
msgs/s, MB/s |
| Aggregate | nats bench NATS Pub/Sub stats |
msgs/s (fan-out counts both sides) |
| Publisher spread | nats min/avg/max msgs/s | not delay |
| One-way-ish RTT | latency.mjs header timestamp |
min, avg, p50, p90, p99, max |
| Host load | /proc/loadavg before and after |
load average |
| Broker counters | http://127.0.0.1:8222/varz inside each nats LXC |
connections, in/out msgs, cpu, mem |
Important: nats CLI 0.1.6 min/avg/max are rate spread across publishers, not microseconds of delay. Delay is only latency.mjs.
4.5 Controls and constants
- Cluster name
verae, three routes, client:4222, cluster:6222, monitor loopback:8222. - Client URL always the three-node list on
vmbr1(never host127.0.0.1:4222, nevervmbr0). - Bench client is LXC 510, not a nats-* server.
- JetStream bench stream name
benchstream, file storage, replicas=3, deleted between JS loads (nats stream rm --force) so names do not collide. - Product streams were not the bench target (no load test on
ZAPIER_*/VERAE_ARCHIVE). - No TLS, no nkeys, no account isolation (isolation is
vmbr1). - Same nats CLI version (0.1.6) and
nats@2Node client as the first ladder.
4.6 Procedure
- Confirm this script is executing on NS1.GEORGELAMBERT.ORG. Refuse otherwise.
- Snapshot host load, memory, LXC configs, and each nats
varz. - From NS1,
pct exec 510the core ladder (1p1s, 4p4s, 8p8s at 128 B; 4p4s at 1 KiB). - Delete
benchstream; JS ladder (1p, 4p, 4p×1 KiB, 2p2s pull) at replicas=3 file. - Copy
latency.mjsinto 510; ping then flood at several batch sizes. - Snapshot host/
varzagain. - Parse logs on this host; draw charts; write HTML and PDF on this host.
No publish, subscribe, chart, or PDF process runs on the operator laptop for this study.
4.7 Instrumentation path
[NS1 host 70.88.205.138]
   study-on-ns1.sh  (bash + python3)
        |
        | sudo pct exec 510
        v
[LXC 510 verae-px-worker 10.10.10.20]
   nats bench / node latency.mjs
        |
        | NATS client protocol to
        v
[LXC 511/512/513  10.10.10.21-23 :4222]
   nats-server -js  cluster routes :6222
The hypervisor issues the guest commands. The messages themselves never leave vmbr1.
4.8 Threats to validity
| Threat | Effect on numbers |
|---|---|
| One physical host | Three “replicas” share CPU, memory, and usually the same datastore. This measures process/LXC HA, not disk HA. |
| Shared load | NS1 also runs Caddy, Forgejo, keep, fleet, portal, and other CTs. Load average during a run is part of the result, not noise to ignore. |
| Single bench client | All publishers live in 510. Per-publisher rate spread is contention in that guest. |
| Short runs | Seconds of traffic. No compaction, no multi-hour page-cache eviction, no snapshot during load. |
| No TLS/nkeys | Production auth will cost CPU. Do not treat these rates as post-nkeys rates. |
| Fan-out aggregate | Core aggregate msgs/s counts pub+sub. Do not compare that column to JetStream unique writes. |
| Flood ≠ RTT | Mixing flood averages with ping p99 produces a fake “NATS is slow” story. |
| Lab only | Not a Zapier HTTPS bench and not live api.veraetime.net. |
4.9 Ethics / safety
Bench uses throwaway subjects (bench.core.*, bench.js.*, bench.lat.*) and a throwaway stream. It does not purge product streams. Zapier cloud has no NATS socket.
5. Suggestions for fine-tuning
These follow from the method and from the first ladder on this stand (JetStream ~16k durable 128 B pubs/s; ping ~0.3 ms; flood hundreds of ms). Apply in order of leverage. Re-run this NS1 study after each change so the delta is measured the same way.
5.1 Treat JetStream as the product limiter
Product jobs/events/webhooks/archive are durable. Tuning core NATS to 2M msgs/s will not move a timestamp Zap. Put effort into replica write path and consumer lag, not core fan-out.
5.2 Split storage class by stream
| Stream | Suggested store | Why |
|---|---|---|
ZAPIER_JOBS |
file, r=3 | Work queue; lose-a-job is bad |
ZAPIER_EVENTS |
file r=3, or memory r=3 if events are rebuildable from job status | Hot waiters; measure both |
ZAPIER_WEBHOOKS |
file, r=3, workqueue | HTTPS to Zapier is the slow consumer |
ZAPIER_USAGE |
file, r=3, limits + max-age | Telemetry |
VERAE_ARCHIVE |
file, r=3, on the best disk | Puts are larger and must survive |
Try ZAPIER_EVENTS as memory store in a maintenance window and re-run only the JS + ping/flood steps. If ping stays ~0.3 ms and durable events still ack at a higher rate, keep it; if a CT restart drops in-flight waiters, revert.
5.3 Give JetStream real disks
Today r=3 on three LXC guests on one Proxmox host is three files, one failure domain.
- Bind-mount a distinct SSD/NVMe (or ZFS dataset with its own vdev) into each nats LXC
store_dir. - Set
sync: alwaysonly on archive if you need it; default sync is often enough for jobs and is faster. Measure. - Do not put JetStream
store_diron the same busy rootfs as Forgejo/Caddy if we can avoid it. - When moving to three metal boxes: same configs, private NIC, one disk (or mirror) per node. That is the first change that makes r=3 mean “two boxes can die.”
5.4 Isolate the nats CTs from the rest of NS1
Host load on this box is often already several. Pin:
nats-a/b/c: dedicated cores, no steal from keep/fleet Node processes.- Memory high enough that file-backed streams stay cache-hot for the working set.
cpuunits/ cpuset inpct configso a Zapier-facing Node GC pause does not stall fsync.
Re-run this study after pinning; H1/H2 should move more than ping.
5.5 Consumer and mailbox tuning (delay H4)
Flood delay is backlog / consume_rate. Fine-tune the waiters, not the broker RTT.
jobs.eventsandwebhooks.deliver: raisemax_ack_pendingso a slow HTTPS hook does not stall the whole consumer; cap it so a poison message cannot unbounded-buffer RAM.- Pull consumers: larger batch, shorter
expires, more pullers horizontally (fleet replica floors) instead of one fat subscriber. - Middleware should not flood-publish then wait; it already does per-job publish. Keep that. The flood test is the outage profile when a consumer is stopped.
- Alert on consumer lag (pending + ack pending) from JetStream, not on ping RTT.
5.6 Publisher-side batching in middleware
A timestamp job is one small JSON. 16k msgs/s is ample. Still:
- Avoid per-byte publishes; one message per job/event.
- Reuse NATS connections (connection churn showed up as publisher spread in the core 4p/8p runs).
- Idempotent
msg id/ duplicate window sized to Verae retry window, not default-only.
5.7 nats-server knobs worth measuring (A/B with this script)
| Knob | Why try it |
|---|---|
max_payload |
Keep default unless archive puts grow |
write_deadline |
Slow consumer protection for webhooks |
max_pending |
Bound memory on a stuck Zapier hook |
max_connections |
Fleet workers + keep + middleware |
JetStream max_file_store / max_memory_store |
Prevent one stream from filling the CT |
max_outstanding_catchup |
Replica restart after a nats-c blip |
| GOMAXPROCS = LXC cores | Do not overthread a 2-core CT |
Change one knob, re-run study-on-ns1.sh, compare JetStream 1p 128 B and ping p99.
5.8 Network
- Keep NATS off
vmbr0. No change. - When on metal: dedicated NIC or VLAN for cluster
:6222vs client:4222if possible (replication vs client load). - Check virtio queue counts on the LXC nics if core 1 KiB byte rate plateaus.
5.9 Security cost (when nkeys/mTLS flip)
verae-nats-accounts is still a sketch. Enabling accounts will add CPU on publish. Budget: re-run this exact study after creds are in every NATS_URL, and accept a drop on both core and JS. Do not flip without that measurement.
5.10 Operational fine-tuning (lag, not peak msgs/s)
- Scrape
varz/jszfrom the host overvmbr1(not public). Monitor loopback:8222is invisible to Prometheus on NS1 unless we add a host-side proxy on10.10.10.21:8222bound only tovmbr1. - Keep replica floors for webhook-deliver and job-poller — they are the flood defense.
- Backup/restore drill of JetStream during idle, then a short JS 1p run to see catchup cost.
- A 15–30 minute soak (not in this ladder) for page cache and compaction; add that as a third study when disks are dedicated.
5.11 What not to tune
- Do not chase core 8p8s aggregate. It is fan-out on a lab bridge.
- Do not treat flood 400 ms as “cluster RTT.” Fix consumers.
- Do not load-test on
ZAPIER_*streams. - Do not bind client NATS to
0.0.0.0onvmbr0.
5.12 Recommended next experiments (same method, one change each)
- CPU pin nats-a/b/c → re-run JS 1p + ping.
ZAPIER_EVENTS-shaped memory stream vs file (throwaway stream, same flags as this JS ladder).- Distinct
store_dirdisks per node. - nkeys on, same ladder.
- Three hardware boxes, same
cluster.envIPs updated.
Each experiment should produce a new results/<utc>/ on NS1 and a new progress-repo report so we can diff H1–H5 instead of arguing from memory.
6. Reproducing this study
On NS1 only:
cd ~/verae-src/verae-nats-cluster
bash scripts/study-on-ns1.sh
The script exits if hostname is not NS1. Outputs land in results/<utc>/ including nats-cluster-bench-ns1.{md,html,pdf} and charts/. Copy those into zapier-decisions/reports/ for the progress repo and catalog.
Raw logs for this run: results/20260912T051237Z/.