 6b9f6327a6
Insert thumbnail galleries linking to full-size images hosted on
GitHub Pages for budget-allocator, cohort-heatmap, customer-segmentation,
scenario-modeler, and system-monitor server examples.

🤖 Generated with [Claude Code](https://claude.com/claude-code)

Co-Authored-By: Claude <noreply@anthropic.com>
2.4 KiB
2.4 KiB
Example: System Monitor App
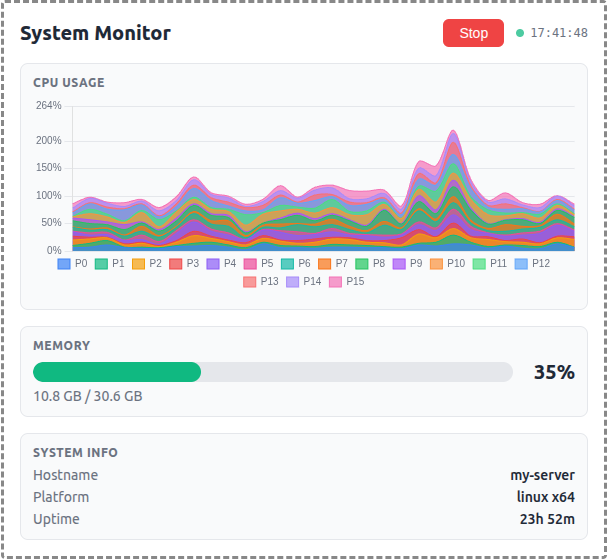
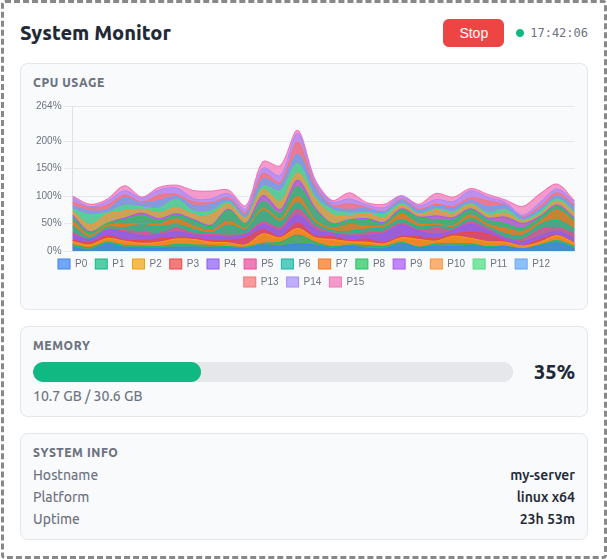
A demo MCP App that displays real-time OS metrics with a stacked area chart for per-core CPU usage and a bar gauge for memory.
 |
 |
 |
Features
- Per-Core CPU Monitoring: Stacked area chart showing individual CPU core utilization over a 1-minute sliding window
- Memory Usage: Horizontal bar gauge with color-coded thresholds (green/yellow/red)
- System Info: Hostname, platform, and uptime display
- Auto-Polling: Automatically starts monitoring on load with 2-second refresh interval
- Theme Support: Adapts to light/dark mode preferences
Running
-
Install dependencies:
npm install -
Build and start the server:
npm startThe server will listen on
http://localhost:3001/mcp. -
View using the
basic-hostexample or another MCP Apps-compatible host.
Architecture
Server (server.ts)
Exposes a single get-system-stats tool that returns:
- Raw per-core CPU timing data (idle/total counters)
- Memory usage (used/total/percentage)
- System info (hostname, platform, uptime)
The tool is linked to a UI resource via _meta[RESOURCE_URI_META_KEY].
App (src/mcp-app.ts)
- Uses Chart.js for the stacked area chart visualization
- Polls the server tool every 2 seconds
- Computes CPU usage percentages client-side from timing deltas
- Maintains a 30-point history (1 minute at 2s intervals)
- Updates all UI elements on each poll