 d03123bb5c
* docs: add local development MCP client configuration to READMEs

Add instructions for configuring MCP clients to use locally-cloned
and modified servers. This allows developers to test local changes
with MCP clients like Claude Desktop or VS Code.

- Top-level README: Added 'Local Development' section after npx config
- All TypeScript examples: Added 'Local Development' subsection with
  bash one-liner that builds and runs the server
- Python examples (qr-server, say-server): Added local path config

* docs: include all servers in local development config

* docs: use bash wrapper for Python server configs to enable tilde expansion
3.1 KiB
3.1 KiB
Example: System Monitor App
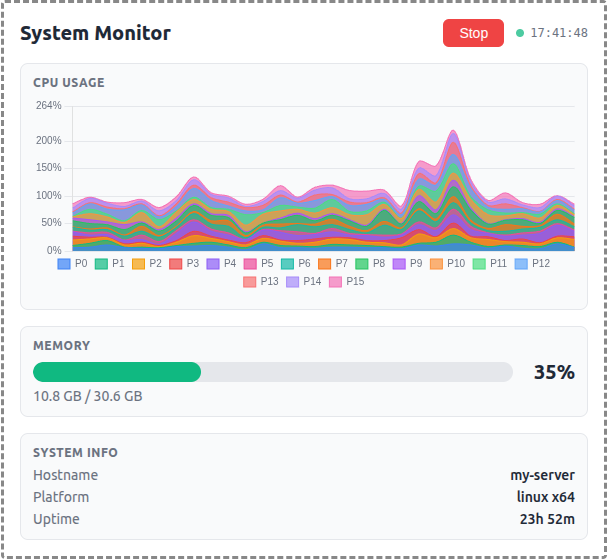
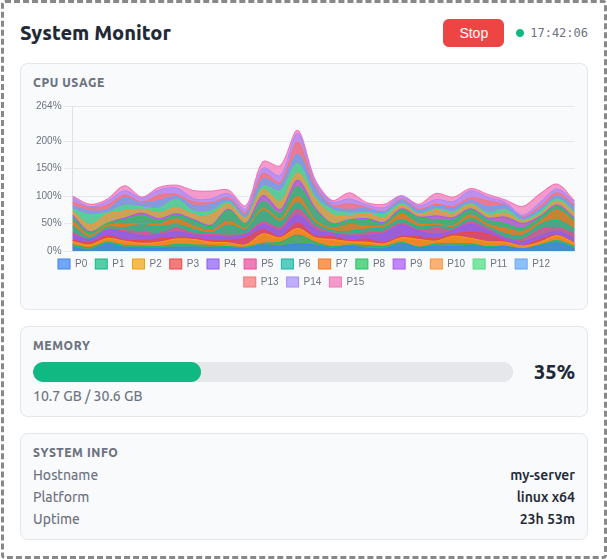
A demo MCP App that displays real-time OS metrics with a stacked area chart for per-core CPU usage and a bar gauge for memory.
 |
 |
 |
MCP Client Configuration
Add to your MCP client configuration (stdio transport):
{
  "mcpServers": {
    "system-monitor": {
      "command": "npx",
      "args": [
        "-y",
        "--silent",
        "--registry=https://registry.npmjs.org/",
        "@modelcontextprotocol/server-system-monitor",
        "--stdio"
      ]
    }
  }
}
Local Development
To test local modifications, use this configuration (replace ~/code/ext-apps with your clone path):
{
  "mcpServers": {
    "system-monitor": {
      "command": "bash",
      "args": ["-c", "cd ~/code/ext-apps/examples/system-monitor-server && npm run build >&2 && node dist/index.js --stdio"]
    }
  }
}
Features
- Per-Core CPU Monitoring: Stacked area chart showing individual CPU core utilization over a 1-minute sliding window
- Memory Usage: Horizontal bar gauge with color-coded thresholds (green/yellow/red)
- System Info: Hostname, platform, and uptime display
- Auto-Polling: Automatically starts monitoring on load with 2-second refresh interval
- Theme Support: Adapts to light/dark mode preferences
Running
-
Install dependencies:
npm install -
Build and start the server:
npm run start:http # for Streamable HTTP transport # OR npm run start:stdio # for stdio transport -
View using the
basic-hostexample or another MCP Apps-compatible host.
Architecture
Server (server.ts)
Exposes a single get-system-stats tool that returns:
- Raw per-core CPU timing data (idle/total counters)
- Memory usage (used/total/percentage)
- System info (hostname, platform, uptime)
The tool is linked to a UI resource via _meta.ui.resourceUri.
App (src/mcp-app.ts)
- Uses Chart.js for the stacked area chart visualization
- Polls the server tool every 2 seconds
- Computes CPU usage percentages client-side from timing deltas
- Maintains a 30-point history (1 minute at 2s intervals)
- Updates all UI elements on each poll